If you’re a homebuyer who's fretting ballooning prices right now, a new analysis of nearly 700 U.S. cities suggests the Atlanta market is drastically more expensive than it used to be—but that things could be much worse.
Construction Coverage, an online publisher of construction industry research reports, published a study this week comparing home-price changes between 2016 and 2026 for 691 cities, both large and small, across all 50 U.S. states.
The good/bad news, depending on perspective: Absolute home-price growth in the City of Atlanta has surged by more than $155,000 over the past decade, in terms of median home prices.
That’s a 67.5-percent increase from 2016, when the typical Atlanta residential property (condos, townhomes, and single-family houses) was fetching a median price of around $230,000, according to Construction Coverage’s findings.
Big picture, however, Atlanta’s swelling home prices ranked middle-of-the-pack among all cities, charting at No. 493 of the 691 places studied.
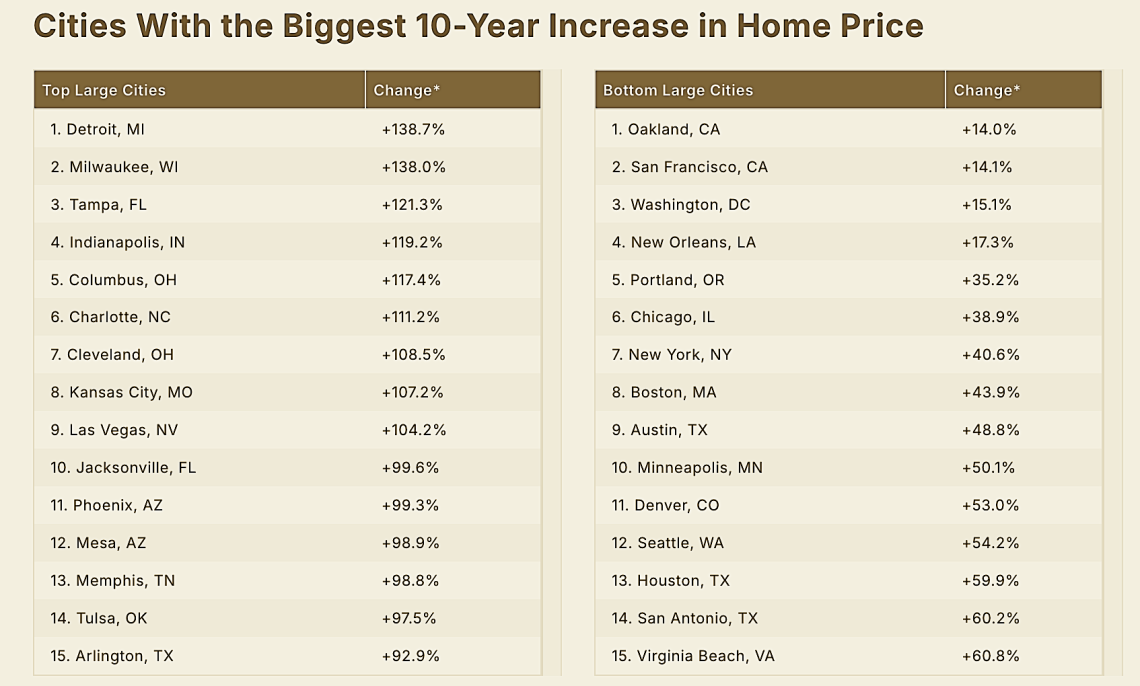
In terms of large cities, Atlanta ranked No. 38 of 54 for price growth, per analysts. Detroit leads that category.
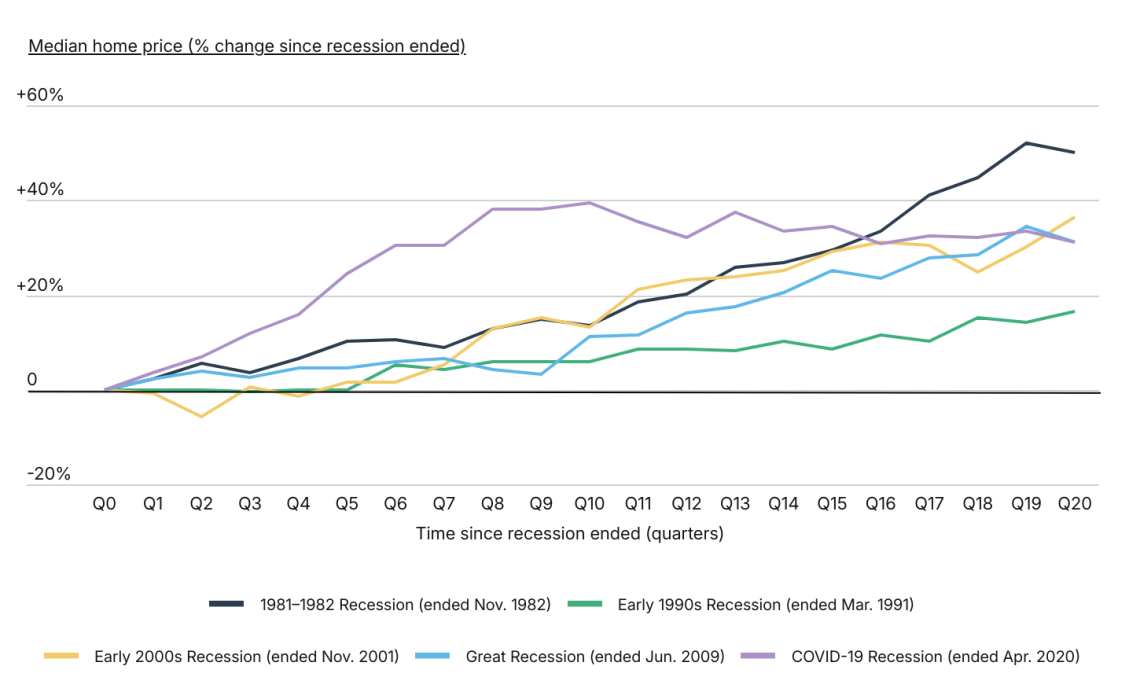 A line graph illustrating how home price growth after the COVID-19 recession was unprecedented but is now regressing to historical norms, per analysts.
Source: Construction Coverage analysis of U.S. Department of Housing and Urban Development data
A line graph illustrating how home price growth after the COVID-19 recession was unprecedented but is now regressing to historical norms, per analysts.
Source: Construction Coverage analysis of U.S. Department of Housing and Urban Development data
Unsurprisingly, the latest available income data shows that wage growth hasn’t kept pace with spiking home costs, as median household incomes in Atlanta rose about 84 percent between 2014 and 2024. (That number, on a positive note, is good for third place among large cities, per Construction Coverage.)
More broadly, the analysis found the U.S. real estate market “appears to finally be cooling down,” although unevenly so, following the unprecedented spike after a brief COVID-19 recession in 2020.
On a state level, Idaho and New Hampshire have seen the most significant growth, with median home prices increasing by 137 and 114 percent, respectively.
Other top states include Maine (+110 percent), Utah (109 percent), Montana (106 percent), Tennessee (105 percent), Rhode Island (104 percent), and yes Georgia (101 percent).
Conversely, Louisiana (+17 percent), North Dakota (+25 percent), and Alaska (+39 percent) saw “home-price growth barely keeping pace with [Consumer Price Index] growth over the past decade,” per the study.
“Generally, parts of the Midwest, along with certain pockets of the South and Northeast, reported the slowest growth in home prices nationally during this period,” reads a recap.
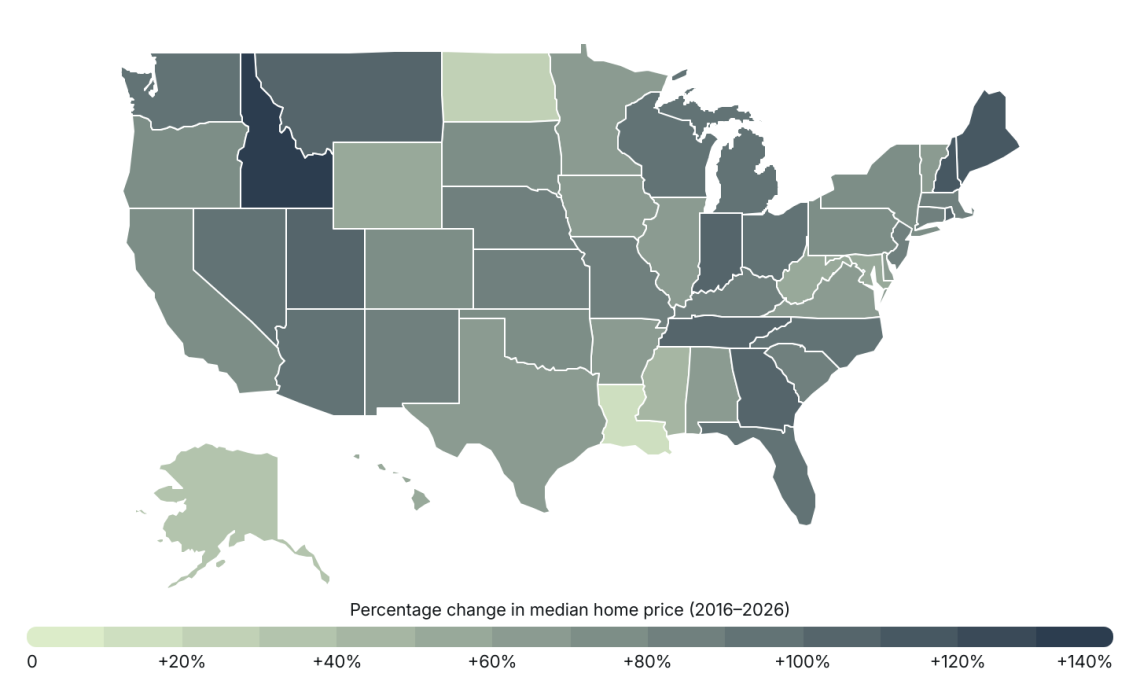 A graphic illustrating home-price growth by state over the past decade.
Source: Construction Coverage analysis of Zillow data
A graphic illustrating home-price growth by state over the past decade.
Source: Construction Coverage analysis of Zillow data
The study pulled data from Zillow’s Home Value Index and the U.S. Census Bureau’s American Community Survey.
Cities were broken into three categories: Large (more than 350,000 people), midsize (between 150,000 and 350,000 people), and small (less than 150,000 people).
Below is a summary of the study’s data for ATL, followed by a broader national outlook for cities.
City of Atlanta:
- Percentage change in median home price (2016–2026): +67.5 percent
- Total change in median home price (2016–2026): +$155,401
- Median home price (March 2026): $385,599
- Median home price (March 2016): $230,198
- Percentage change in median household income (2014–2024): +84.4 percent
- Median household income (2024): $85,652
Statistics for the entire United States:
- Percentage change in median home price (2016–2026): +81.3 percent
- Total change in median home price (2016–2026): +$164,181
- Median home price (March 2026): $366,019
- Median home price (March 2016): $201,838
- Percentage change in median household income (2014–2024): +51.0 percent
- Median household income (2024): $80,734
 Construction Coverage analysis
...
Follow us on social media:
Twitter / Facebook/and now: Instagram
• Interactive map shows home-value disparity across ATL neighborhoods (Urbanize Atlanta)